KPI dashboard for SMEs: definition, metric examples, and how to build one
G. CHRIST
Published on November 3, 2026

"We feel busy… but we don't really know if we're moving forward." We hear this often from SME owners, NGO managers and institutional teams in Benin and French-speaking Africa. WhatsApp threads overflow, quotes go out, Mobile Money payments land — yet at month-end nobody can clearly say how many quotes converted, how many days of cash remain, or how many clients are late on payment.
A KPI dashboard answers exactly that. It is not a pretty spreadsheet, nor a screen full of useless charts. It is a steering tool: a few chosen metrics, kept up to date and shared, that help you decide.
At Guelichweb we help organisations in Cotonou, Abomey-Calavi and beyond connect websites, WhatsApp, CRM and automations. In this guide we explain what a KPI is (and what is not one), which metrics make sense for an SME or NGO, how to build a first dashboard with Google Sheets then Looker Studio, how to plug in your data (forms, website, CRM, n8n/Make), and which mistakes to avoid. We invent no prices here: for tailored support we issue a quote after a diagnostic.
In short: a KPI is a metric tied to a goal. Start with 5–8 KPIs max. Google Sheets is enough to begin; Looker Studio makes the board readable and shareable. Then connect your sources (Forms, site, CRM, WhatsApp via automation). Review it every week — otherwise it is only decoration.
What is a KPI? (and how it differs from a plain metric)
KPI means *Key Performance Indicator*. The idea is not new: France's public service guide on management dashboards stresses that a dashboard helps you track activity and make decisions.
The key nuance:
- A metric measures something (WhatsApp messages received, page views, litres of fuel).
- A KPI is a metric tied to a goal and useful for decisions. Example: "quote-to-order conversion rate ≥ 30% this quarter".
If you track 40 numbers with no goals, you have a data catalogue — not a dashboard. If you track 6 numbers that say whether you hit priorities (cash, sales, service quality), you have real steering.
Four qualities of a good KPI
- Understandable in one sentence by the whole team (not only the accountant).
- Measurable with data you can actually collect (not a fantasy of 0.1% precision).
- Actionable: if the number drops, someone knows what to do this week.
- Comparable over time (week, month, quarter) with a stable method.
Why an SME, NGO or institution needs a dashboard
In many organisations we meet, "reporting" means reopening WhatsApp, scrolling, asking the salesperson "where are we?", and hoping. That works with two people. Beyond that — or as soon as a donor or board asks for numbers — it breaks.
A well-designed dashboard helps you:
- Spot early a cash or pipeline problem (before the crisis).
- Align the team on the same priorities (fewer debates "on feeling").
- Prepare a committee, donor report or monthly review in 15 minutes instead of two days.
- Link digital to business: a website or contact form is useless if nobody tracks response rate.
It is also a realistic lever of digital transformation: you do not digitise for fashion — you digitise to decide better.
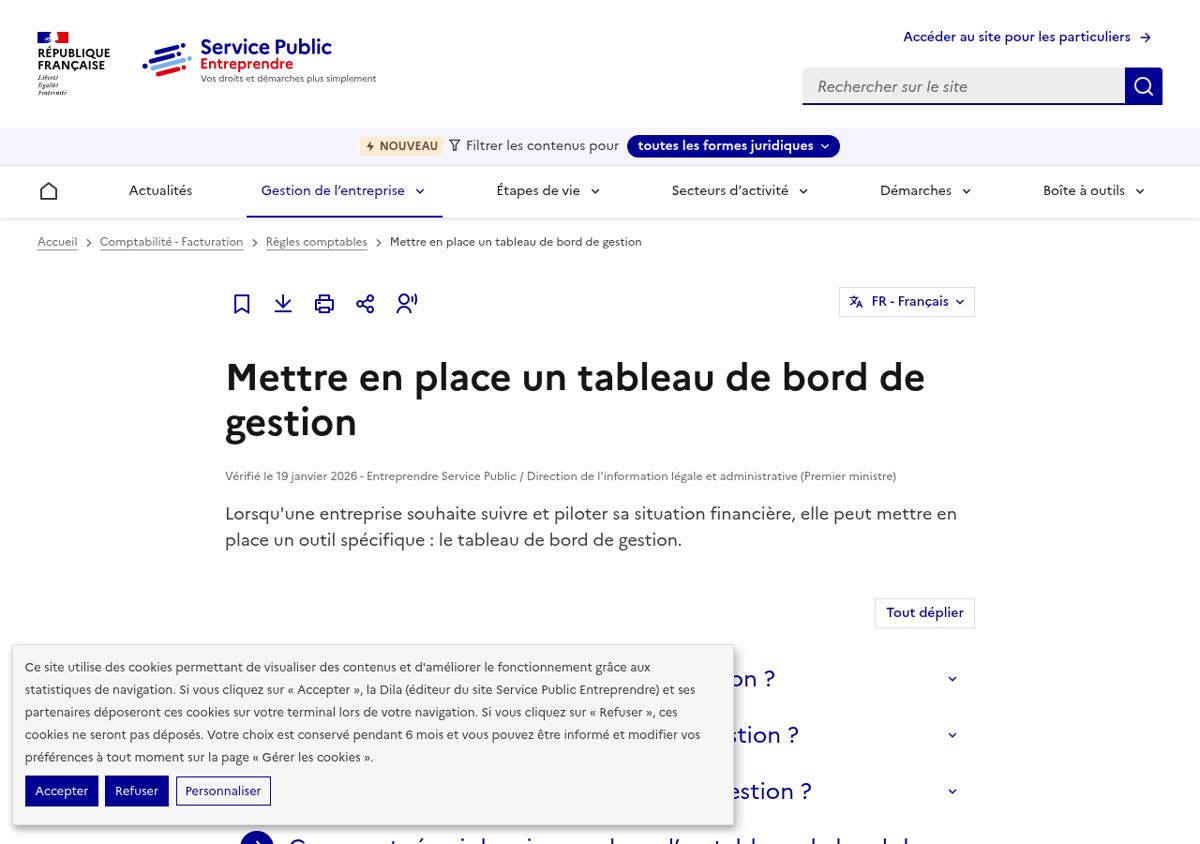
Source: Setting up a management dashboard — Service-Public.fr, captured on 03/11/2026.
Realistic KPI examples for SMEs / NGOs / institutions
Here is a list we often use as a discussion base. Adapt it to your sector: a clinic, an NGO, a shop or an agency do not share the same priorities. Keep 5 to 8 to start, not 25.
1. Monthly revenue
Amount invoiced or cash collected (pick one convention and stick to it). Without tracked revenue, the rest of the board floats.
2. Gross margin (or margin rate)
Revenue minus direct costs (goods, billed subcontracting). An activity that "runs hot" while margin melts is not healthy — even if WhatsApp is full of orders.
3. Available cash (days of cash)
Bank + Mobile Money + cash on hand, divided by average daily spend. How many days can you last without a new inflow? Often the most vital KPI for an SME.
4. DSO — average customer payment delay
Average days between invoice and payment. A lengthening DSO often explains tight cash despite "good" revenue.
5. Order book / pipeline
Amount (or count) of open quotes, ranked by probability (cold / warm / hot). For an NGO: amount of proposals / grants in progress.
6. Quote → order conversion rate
Accepted quotes ÷ quotes sent over the period. If you send 40 quotes and win 4, the issue may not be "not enough leads" but price, response time or follow-up.
7. WhatsApp → quote (or lead → quote)
In Benin a large share of demand arrives on WhatsApp. Measure: qualified inbound messages → quotes sent. Without this ratio you do not know whether your chatbot or catalogue actually helps sales.
8. Average response time to requests
Hours (or minutes) between the first message / form and the first human reply. A lead unanswered for 24 hours is often a lost lead — especially if a competitor replies in 30 minutes.
9. Website form handling rate
Forms received and (better) forms handled within X hours. Directly links your website to sales execution. See also our contact form guide.
10. Show / no-show rate (appointments, trainings, clinics)
For structures that book appointments: % of appointments kept. Useful with online booking and automated reminders.
11. Customer acquisition cost (if you spend on ads)
Marketing spend ÷ new paying customers. Even with a small Facebook/TikTok Ads budget, this KPI prevents buying useless volume.
12. Satisfaction / simplified NPS (services & NGOs)
One question after delivery: "Would you recommend our service?" (0–10). No expensive tool needed: a Google Form + Sheet is enough at first.
For an NGO or institution, replace revenue/margin with: budget execution rate, beneficiaries reached vs target, donor reporting delay, accepted justification rate. The KPI logic stays the same: goal → measure → decision.
Build a first dashboard with Google Sheets
Do not start with a complex "BI" tool. Google Sheets (included in Google Workspace or usable with a Google account) is enough for a steering MVP.
Official Google Sheets logo, reproduced for illustration.
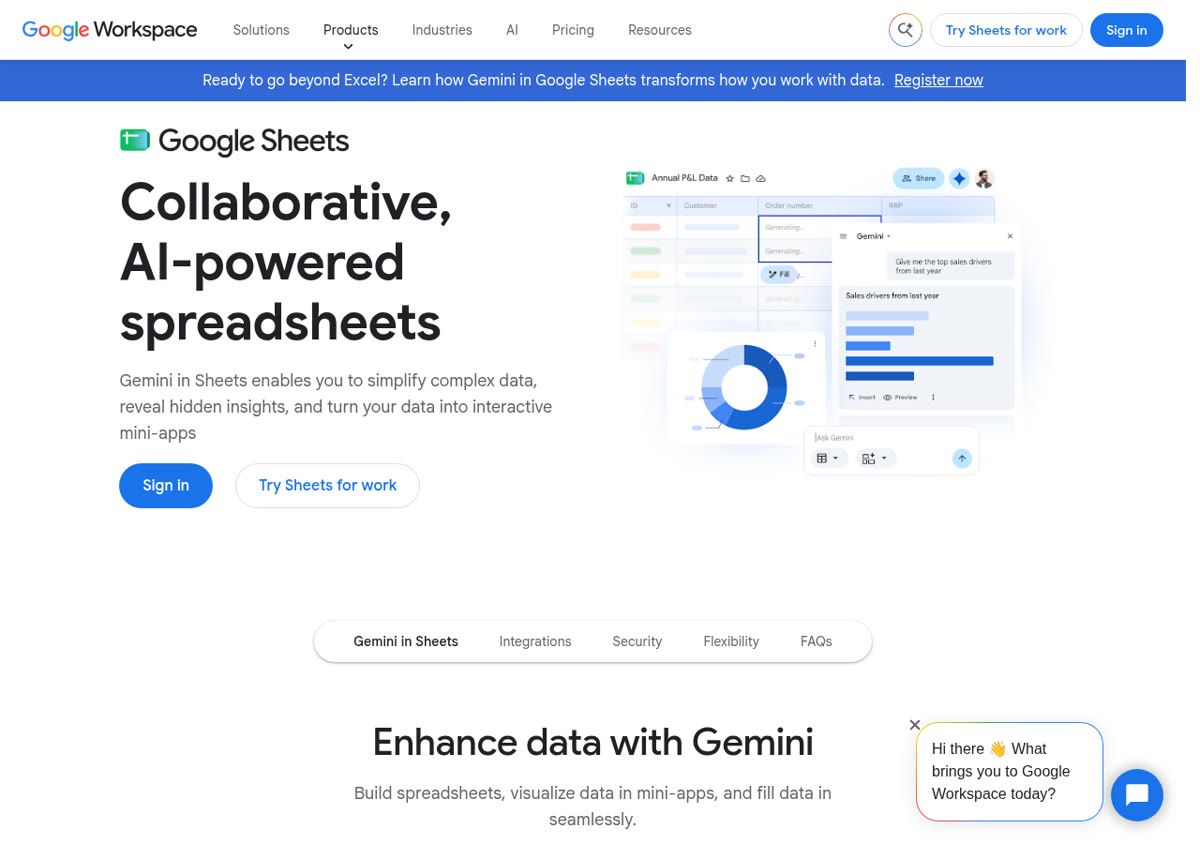
Source: Google Sheets product page, captured on 03/11/2026.
Recommended minimal structure (3 tabs)
- Raw data: one row = one event (quote, payment, lead, appointment). Dated columns; never mix totals here.
- KPI calculations: formulas (SUMIF, COUNTIF, averages) that aggregate the current week / month.
- Dashboard: big numbers + 2–3 charts. This is the only sheet leadership opens daily.
Seven-step method
- List your 5–8 KPIs and the exact definition of each (e.g. revenue = invoiced incl. tax or cash collected?).
- Identify the source of each data point (manual WhatsApp, Form, CRM, bank, existing Excel).
- Create the Raw data tab with stable columns (date, type, amount, status, owner).
- Fill 2–4 weeks of history — even approximate at first.
- Compute KPIs on the Calculations tab (one cell = one KPI for the month).
- On Dashboard, show large values + a trend chart. Google Sheets help covers chart creation.
- Set a routine: daily update (5–10 min) or weekly, review every Monday morning.
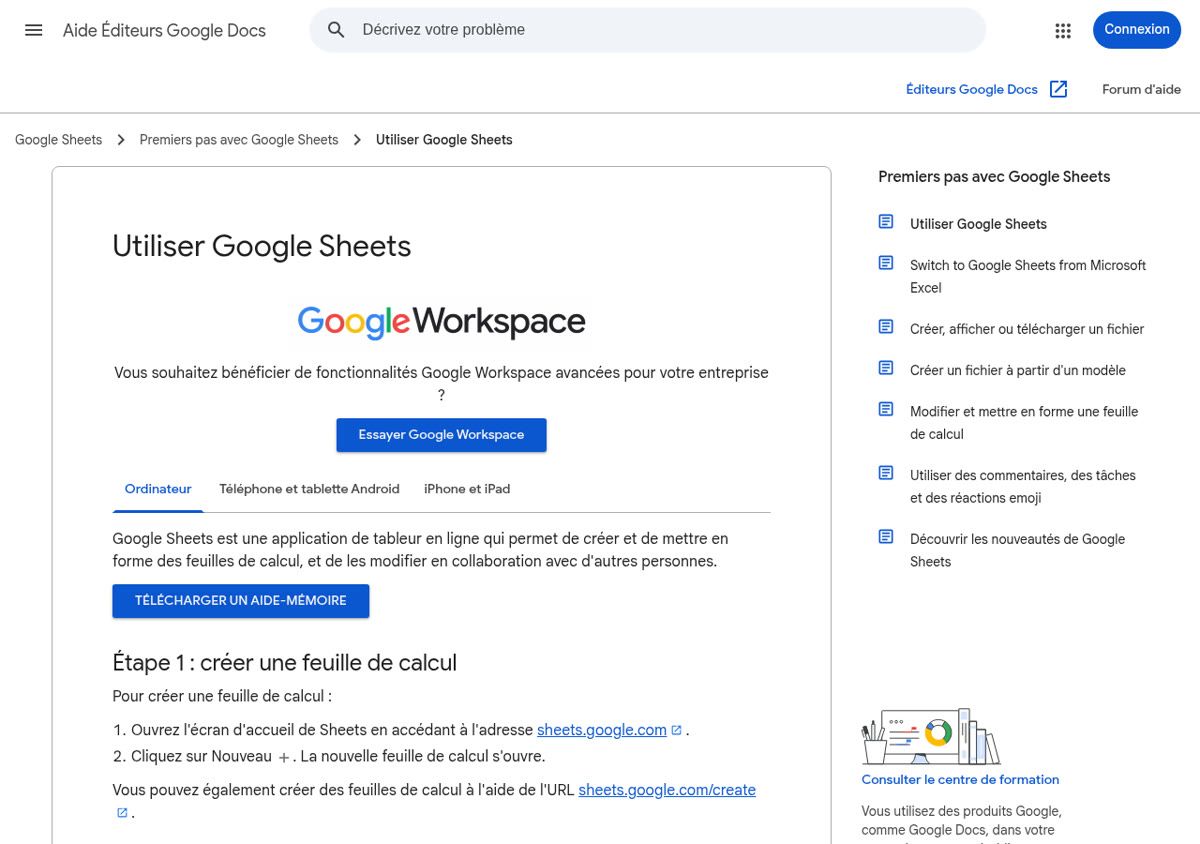
Source: Google Help — Add and edit a chart, captured on 03/11/2026.
West Africa tip: add a channel column (WhatsApp, website, word of mouth, field) and a payment method column (transfer, Mobile Money, cash). Those two dimensions often explain more than the amount alone.
Move to Looker Studio for a readable, shareable board
When the Sheet becomes hard to read (too many rows, several contributors, need filters by period / branch / project), Looker Studio (formerly Google Data Studio) is the natural next step — free for most uses, natively connected to Sheets.

Looker Studio product icon (historic Data Studio mark), Google CDN, for illustration.
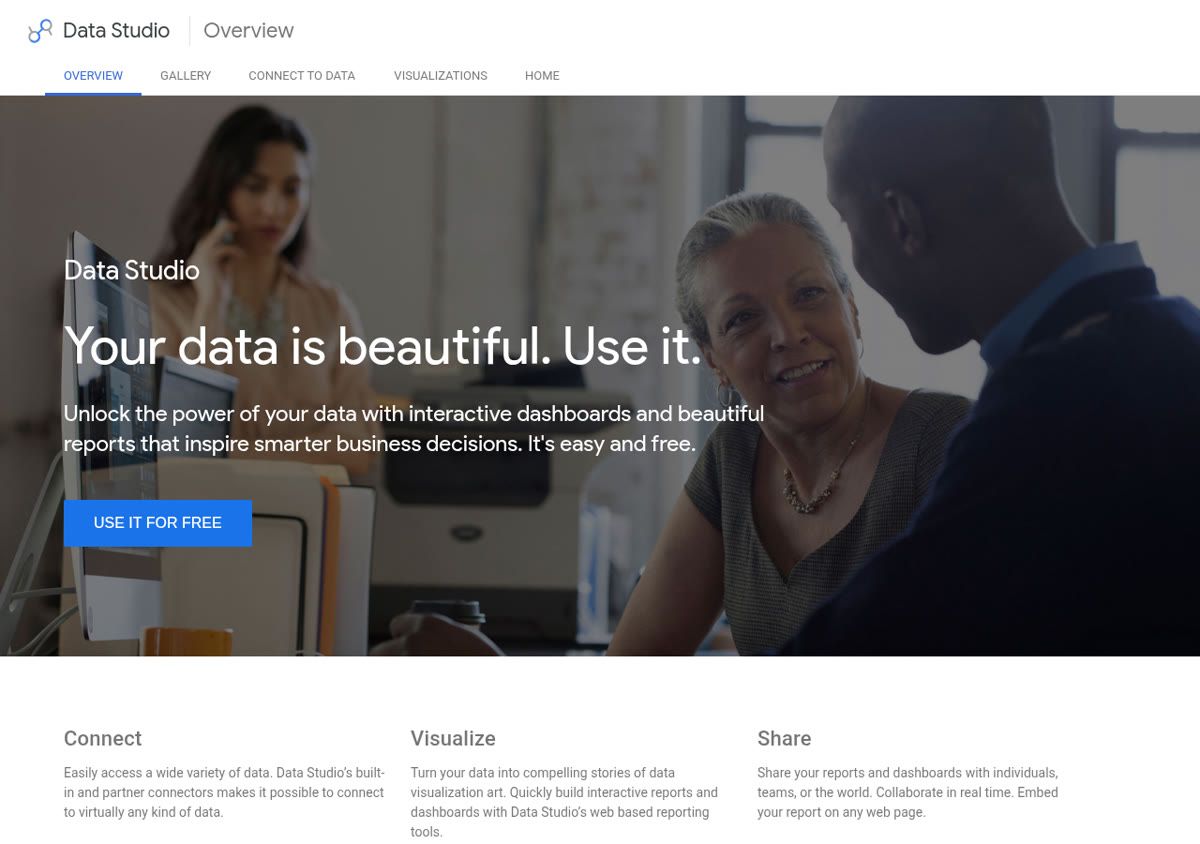
Source: Looker Studio — Overview, captured on 03/11/2026 (the public marketing page may still show the former Data Studio name).
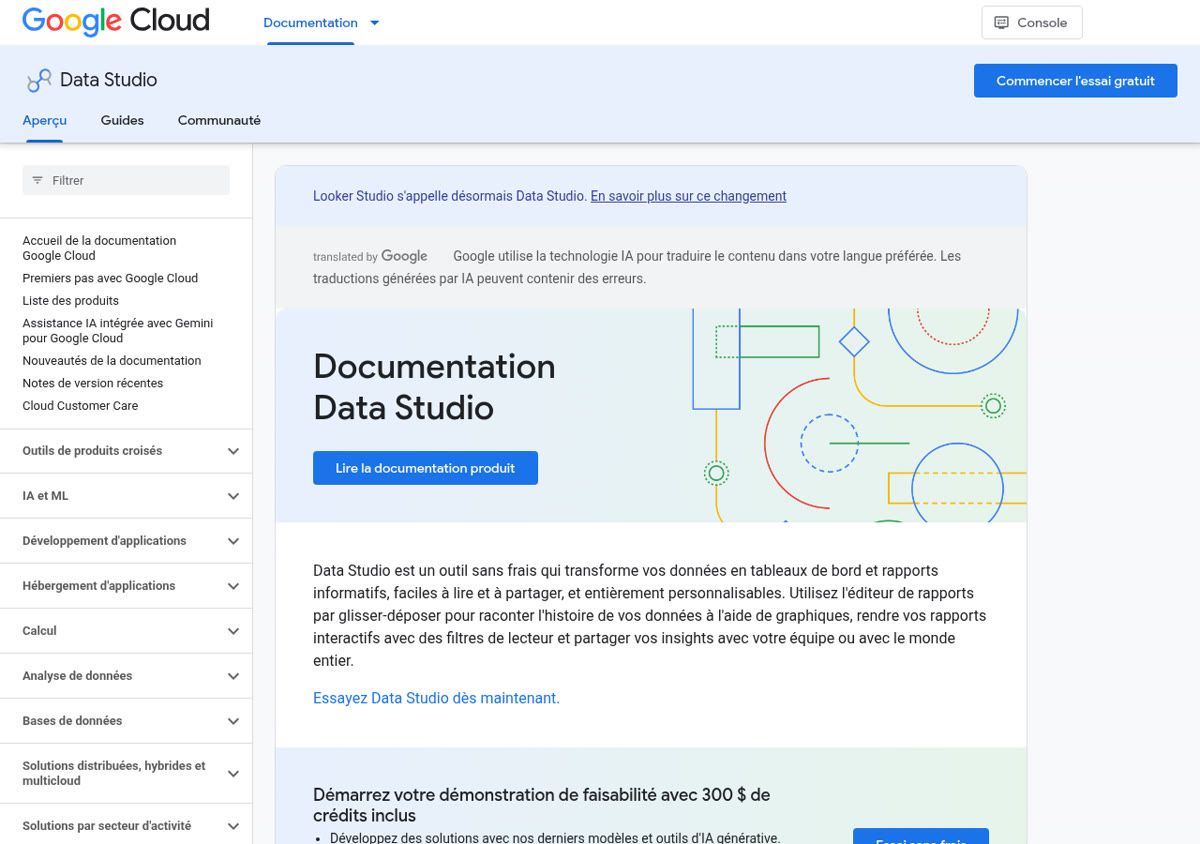
Source: Looker Studio Help, captured on 03/11/2026.
What Looker Studio adds in practice
- Layout like a steering screen (scorecards, date filters, tabs).
- Sharing by link (read-only for a board, donor or partner).
- Refresh when the source Sheet is updated.
- Connectors to other sources (GA4, Google Ads, BigQuery, etc.) when you are ready — see the official help.
Simple Sheets → Looker Studio path
- First stabilise your Sheet columns (renaming a column breaks the report).
- In Looker Studio, create a data source → Google Sheets → pick the workbook and tab.
- Add scorecards for monthly KPIs, a time series, a detail table.
- Add a date range control at the top of the report.
- Share as "view" to decision-makers; keep edit access to 1–2 people max.
Looker Studio does not replace data quality. If your Sheet is dirty (duplicates, quotes without status, dates as text), the prettiest dashboard will still be wrong.
Connect the data: Forms, website, CRM, n8n / Make
The real maturity jump is not the chart: it is stopping double entry. Here are realistic connections we set up for SMEs and NGOs.
Google Forms → Sheets (free foundation)
Quote requests, registrations, satisfaction surveys: each answer becomes a Sheet row. Perfect to start a "leads / week" KPI with no development.
Website → CRM or Sheet
A contact form or online booking must create a traceable row (status: new / contacted / quoted / won / lost). Otherwise your Cotonou website generates noise, not steering. The article website + WhatsApp + CRM details this chain.
CRM as the commercial source of truth
As soon as several people touch quotes, a CRM (even a simple one) beats a chaotic shared Sheet. The dashboard then reads the CRM (export, API or sync): pipeline, conversion, commercial DSO.
Automate with n8n or Make
Concrete examples:
- New WhatsApp message / lead → Sheet row + owner notification.
- Quote accepted → status update + cash alert.
- Missed appointment → automatic follow-up + increment of the "no-show" KPI.
- Website form → CRM → weekly recap in a team channel.
To choose the tool, see n8n or Make. An AI agent can help classify or summarise, but does not replace clear KPI definitions.
Target schema (simple)
- Inbound channels: website, WhatsApp, field, email.
- Capture: Form / CRM / Sheet (one truth per event type).
- Automation: n8n/Make for status, follow-ups, alerts.
- Presentation: Sheets (MVP) or Looker Studio (committee).
- Human routine: 30 minutes on Monday to read and decide.
Classic mistakes (we see them too often)
- Too many KPIs. 20 indicators = none. Start small.
- KPI with no owner. If nobody owns the number, it will not stay updated.
- Changing the definition every month. You break comparability.
- Vanity metrics. Likes, impressions, "messages received" with no link to quotes or cash-in.
- Double manual entry (WhatsApp + Excel + notebook). Automate or simplify.
- Dashboard never reviewed. A board unopened for 30 days is dead — archive it or enforce the review.
- Ignoring cash. Record revenue with only 5 days of cash still means a fragile organisation.
- Forgetting the field. In Benin, if 80% of sales go through WhatsApp, your KPIs must reflect that — not only Google Analytics.
30-day mini plan
- Week 1: choose 5 KPIs, write their definition, appoint an owner.
- Week 2: create the Sheet (3 tabs), enter recent history.
- Week 3: connect at least one automatic source (Form or website form).
- Week 4: publish a Looker Studio view for leadership; run the first Monday review.
If you want us to build this chain with you (website, CRM, automations, dashboard), reach us via /en/contact: we propose a diagnostic then a tailored quote — with no invented price grid in this article.
FAQ — KPI dashboard for SMEs
Excel or Google Sheets?
Both work. Sheets wins as soon as several people update from different phones and you want to plug Looker Studio / Forms easily. Excel remains useful offline; for team steering we usually recommend Sheets inside a well-administered Workspace.
Is Looker Studio free?
Standard Looker Studio use is free according to Google; partner connectors or advanced needs may be paid. Always check the official help and current terms.
How many KPIs should we track?
5 to 8 for an SME starting out. Beyond that, create secondary boards (sales, finance, ops) rather than one unreadable screen.
What if our WhatsApp data lives "in the phones"?
That is the most common case. Step 1: a team rule (every quote created = one row). Step 2: a tool (light CRM, shared Sheet, or automation). Step 3: only then the pretty dashboard.
Can an accounting firm replace this board?
Accountants often produce ex-post statements (monthly / yearly). A KPI dashboard is operational: it helps decide this week. The two complement each other.
Can we connect Mobile Money?
Yes, depending on your operator / gateway APIs and exports. Meanwhile, a daily 5-minute entry of cash-ins into the Sheet is still better than nothing. Gateways such as FedaPay/KkiaPay can also push transactions to a Sheet via automation.
Conclusion
A KPI dashboard is not a luxury for large companies. It is a shared language for a small team: where are we, what is stuck, what do we decide this week? Start in Sheets, visualise in Looker Studio, connect your real channels (WhatsApp, website, CRM), and above all protect the quality of definitions.
We help SMEs, NGOs and institutions in Cotonou, Abomey-Calavi and remotely to build this chain — from the form to the steering board. Write to us via /en/contact for a diagnostic; the offers / quote path follows, without improvised pricing in a blog post.