Website loading speed: how to test it and improve it (Core Web Vitals explained)
G. CHRIST
Published on October 27, 2026
A visitor taps your link in a WhatsApp chat. They are on a motorbike taxi, on a mobile connection that keeps switching between 4G and 3G, with a few hundred megabytes left until the end of the month. The screen stays white. One second, two, three. They go back to the chat. You will never know they came.
That is what website loading speed is really about: visitors lost in silence. At Guelichweb, when we review the website of a business, an NGO or an institution, slowness is one of the problems we find most often, far more often than design issues. This guide explains how to measure your site's speed with Google's free tools, how to read the results without drowning in jargon, and what to fix first.
Why speed matters even more in West Africa
People often say a fast site pleases Google. That is true, but it is not the best reason to care. The real reason is your audience.
In Benin, in September 2026, roughly six web visits out of ten came from a mobile phone (59.94% according to StatCounter, versus 39.02% from a desktop computer). Many of those phones are entry-level or mid-range models, and network quality changes a lot from one neighbourhood to another and from one hour to the next. Above all, mobile data is paid by the megabyte or through capped bundles. An 8 MB page is not just slow: it costs money to whoever opens it.
Our position is simple: for any organisation serving a West African audience, a slow website is a half-closed website. The most beautiful design in the world is useless if it appears after the visitor has left.
On the search side, Google is clear without being alarmist. Its documentation for site owners "highly recommends" that site owners achieve good Core Web Vitals, because they align with what its core ranking systems seek to reward (Google Search Central). The same page states that good results do not guarantee top rankings. Speed does not replace useful content, but useful content on a painful page loses part of its value. If you want the wider picture, our article What is SEO? SEO vs SEA covers the basics.
Website speed: what exactly are we measuring?
"My site takes 3 seconds to load" does not say much. Three seconds until what? Until something appears, until the main text is readable, until the button responds? Google has broken that feeling down into precise metrics. The three most important ones are called the Core Web Vitals:
- LCP (Largest Contentful Paint): the time it takes to display the largest visible element on load, usually the main image or the big headline. It is the metric that best matches "the page is here".
- INP (Interaction to Next Paint): the delay between a visitor's action (tapping a button, opening a menu) and the page's visible response. It replaced the older FID metric on March 12, 2024 (web.dev).
- CLS (Cumulative Layout Shift): visual stability. You know the feeling: you are about to tap a link, a banner appears above it, everything moves down and you tap something else. CLS measures those jumps.
Two other measurements show up in most reports and help you understand where a problem comes from: FCP (First Contentful Paint, when the first element appears) and TTFB (Time to First Byte, how long the server takes to start responding). A high TTFB almost always points to the hosting or the server configuration.
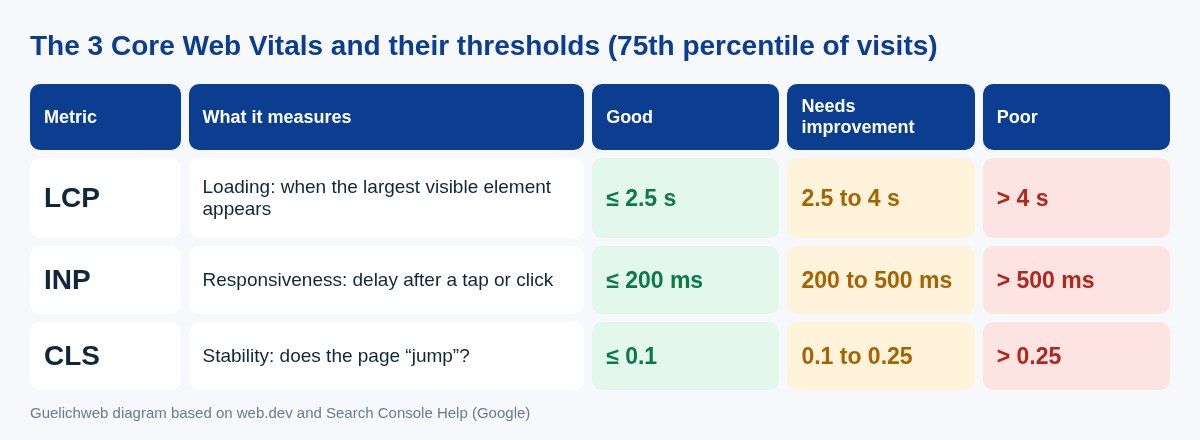
Guelichweb diagram based on web.dev and Google Search Console Help.
These thresholds are assessed at the 75th percentile of visits: for a page to be rated "good", at least three visits out of four must meet the threshold, separately on mobile and desktop (web.dev). In other words, what counts is not your experience on the office Wi-Fi, but the experience of your less fortunate visitors, or close to it.
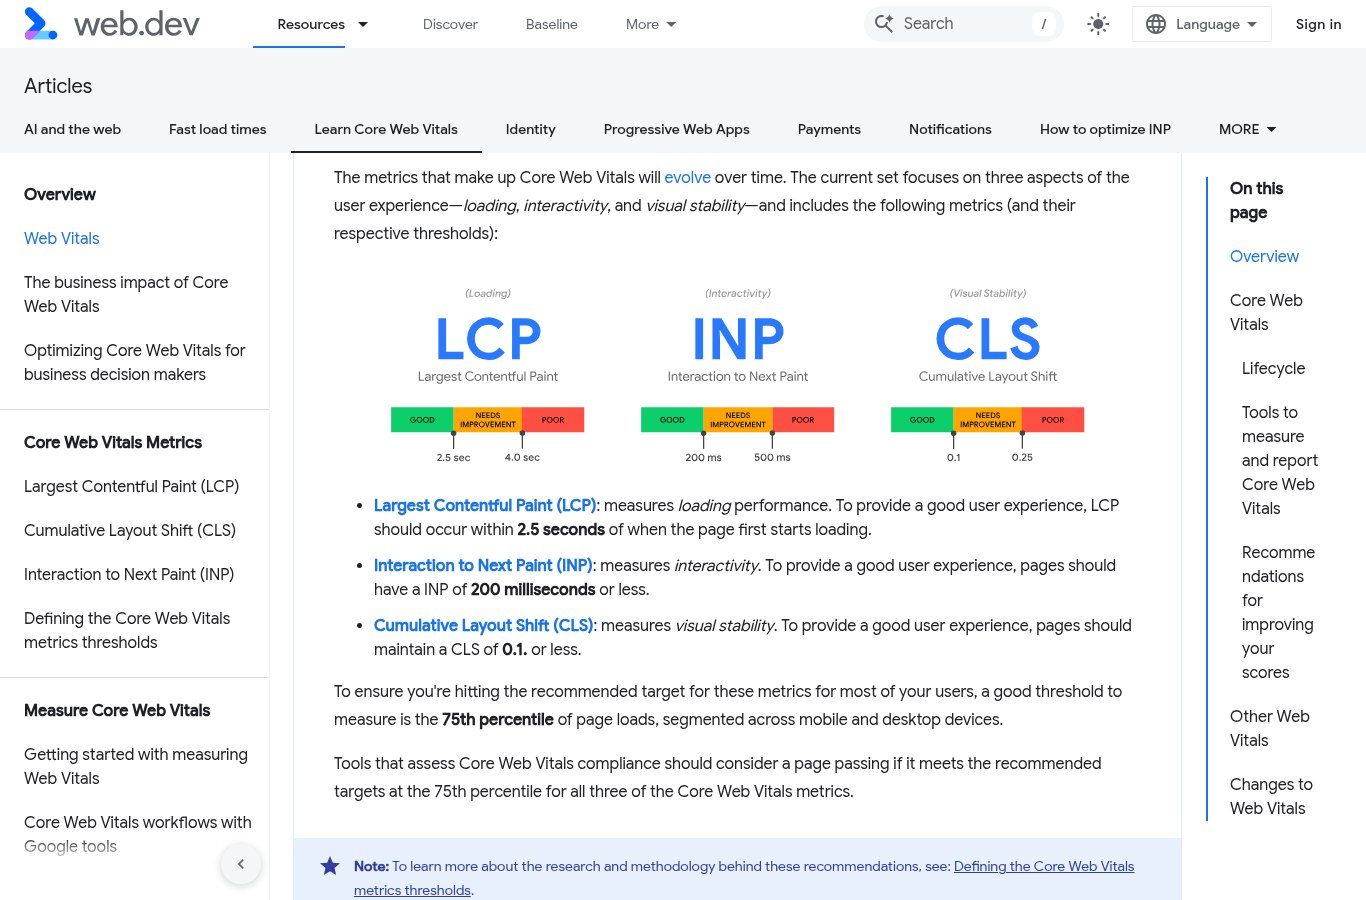
Source: web.dev (Google), "Web Vitals" page, screenshot taken on 27/10/2026.
How to test your website speed: three free tools to know
You do not need to pay for a tool to get started. Google provides everything for free, and these are the same tools we use first during a diagnosis.

Official PageSpeed Insights logo (Google).
1. PageSpeed Insights: the starting point
PageSpeed Insights is the simplest tool: paste the address of a page, click "Analyze", and you get a mobile and a desktop report in under a minute. No account is needed, and you can test any website, including a competitor's.
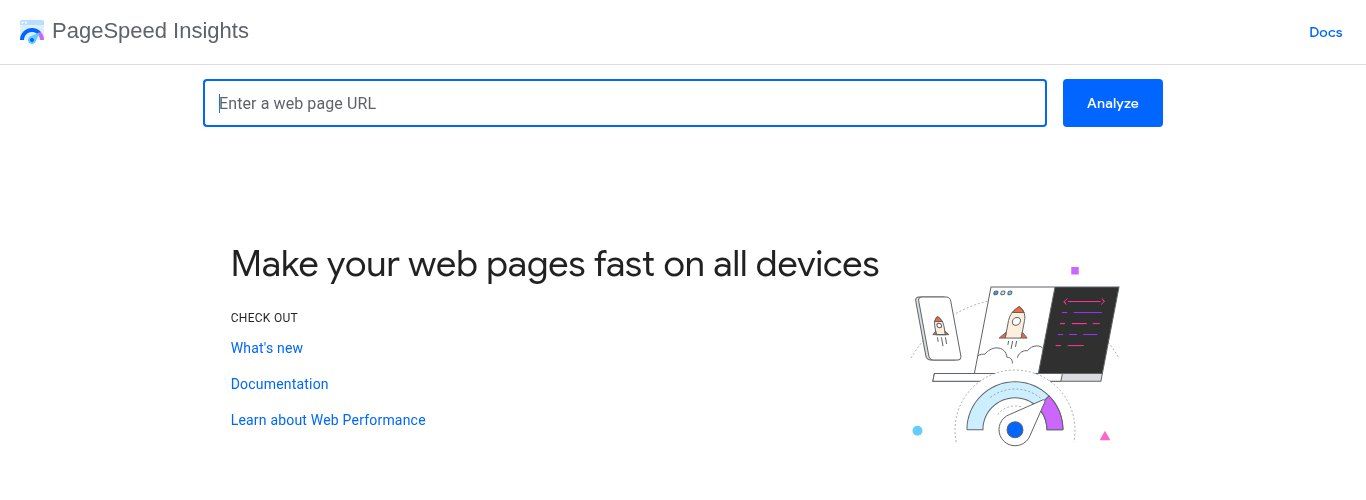
Source: pagespeed.web.dev (Google), screenshot taken on 27/10/2026.
The report has two very different parts, and this is where most people get confused:
- At the top, "Discover what your real users are experiencing": this is real-world data (field data), collected from Chrome users over the last 28 days. This is the part that shows the Core Web Vitals assessment as "Passed" or "Failed".
- Below, "Diagnose performance issues": this is lab data, produced by a single test that Google runs under simulated conditions. The famous score out of 100 comes from here.
Google explains the difference in the PageSpeed Insights documentation. If your site gets few visits, the field data section will be empty because there is not enough data. That is not a bug, and in that case the lab test is your only guide.
A real example: Wikipedia's "Cotonou" page
To show you what a real report looks like, on October 27, 2026 we analysed the mobile version of Wikipedia's page about Cotonou, in both English and French. The comparison is instructive.
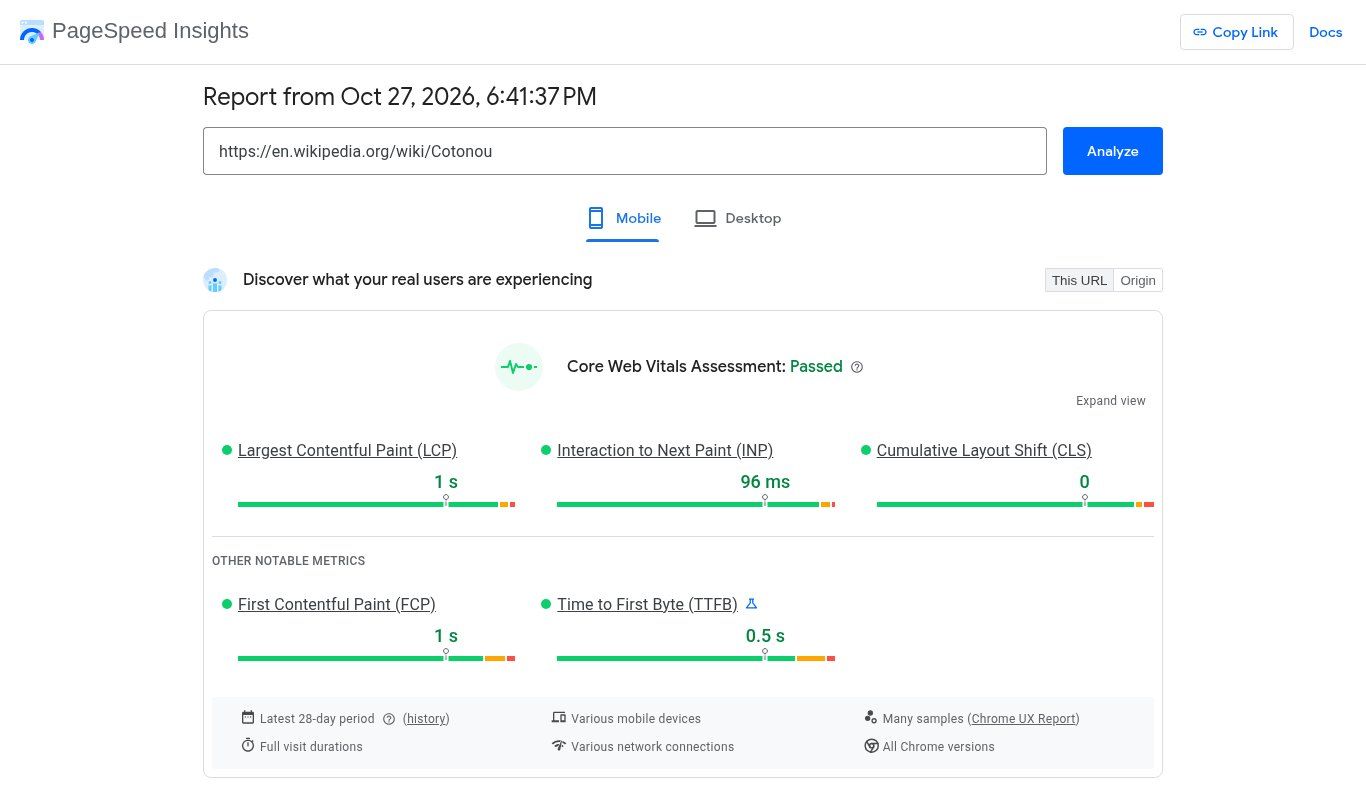
Source: PageSpeed Insights (Google), mobile report for en.wikipedia.org/wiki/Cotonou, 27/10/2026 at 6:41 pm (Benin time).
The English page passes comfortably: LCP 1 s, INP 96 ms, CLS 0. The French-language page about the same city, tested the same day, failed the assessment. Its loading was good (LCP 2.2 s, under the 2.5 s line) and it responded quickly (INP 128 ms), but its CLS was 0.2, above the 0.1 threshold. It loads fast, yet it moves while loading.
Two lessons. First, one metric in orange is enough to fail the assessment, so look at all three. Second, speed is measured page by page, even on the same website: your home page can be excellent and your product page a disaster. At a minimum, test your home page, one content page and the page that gets the most visits from Google.
2. Lighthouse: the detailed diagnosis
Lighthouse is the engine behind the lab section of PageSpeed Insights. It is built into Google Chrome on desktop: right-click the page, choose "Inspect", then open the "Lighthouse" tab. Its main advantage is that it can test a page that is not online yet, or that sits behind a password, which PageSpeed Insights cannot do.
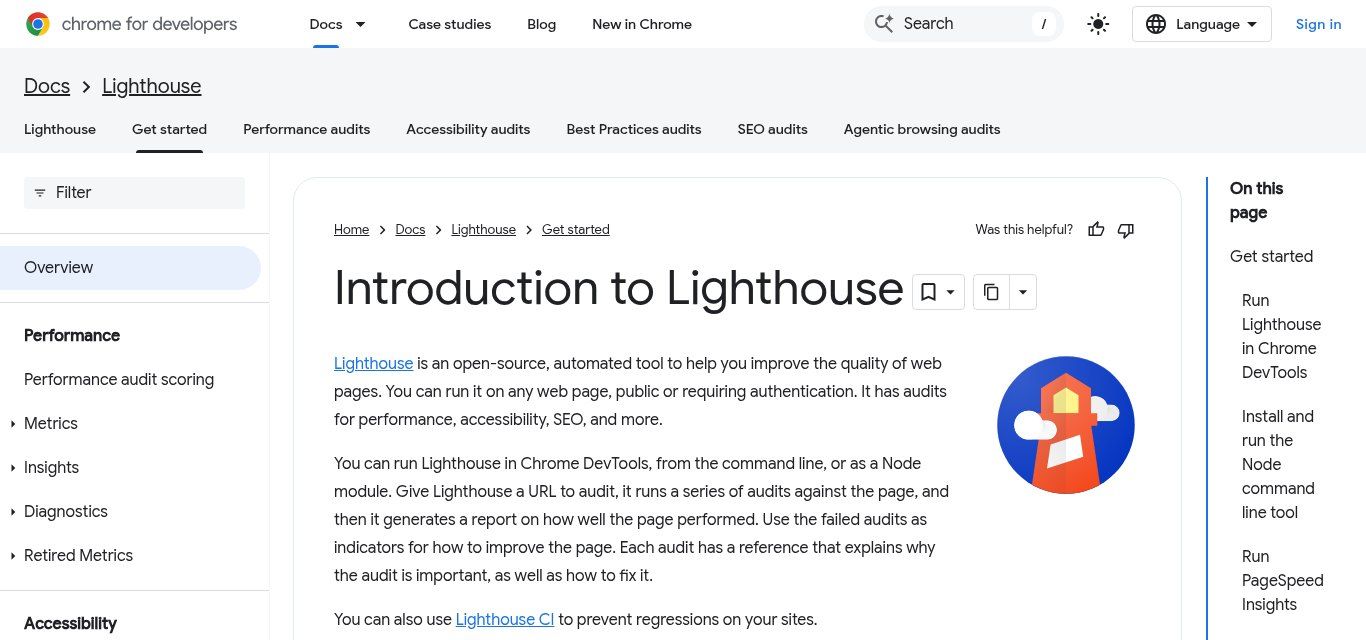
Source: Chrome for Developers (Google), "Introduction to Lighthouse" page, screenshot taken on 27/10/2026.
An important warning: the Lighthouse score varies from one run to the next. Google acknowledges this in its documentation on how the score is calculated: changing ads, internet traffic routing, the device used for testing. Do not celebrate a 92 or panic over a 78 you get five minutes later. Run three tests and look at the trend.
3. The Core Web Vitals report in Search Console
If your site is connected to Google Search Console (and it should be), the Core Web Vitals report groups your pages into "Good", "Need improvement" and "Poor", for mobile and desktop. Its advantage is that it covers the whole site, by groups of similar URLs, instead of one page at a time. It also relies on real Chrome user data, so it needs a minimum of traffic to show anything. For a broader view of how your site shows up on Google, see How to appear on Google.
Why is my website slow? The 7 causes we see most often
Reports list dozens of recommendations. In practice, on the small business and NGO websites we look at, slowness almost always comes from the same places.
- Images that are far too heavy. A 4 MB photo taken with a phone and dropped as-is onto the home page. This is cause number one, by a wide margin. Once properly resized and compressed, a banner image usually fits in a few hundred KB.
- Undersized or poorly located hosting. A TTFB that regularly goes over one second often reveals an overloaded server, an entry-level plan shared with hundreds of other sites, or no caching at all. We cover this choice in Web hosting: free or paid in West Africa.
- Too many WordPress plugins. Every plugin adds code, sometimes on every page. Brochure sites running dozens of active plugins are not rare, and you can feel it. WordPress is not slow by nature, see What is WordPress and when to choose it.
- An overloaded theme or page builder. "All-in-one" themes often load features you do not need: sliders, animations, multiple fonts.
- Third-party scripts. Live chat, ad pixels, embedded maps, social media widgets, embedded videos: each one comes from another server and slows the page down, especially on mobile.
- Badly loaded fonts. Four font families in six weights each is a lot of weight for a benefit nobody notices. They also cause text to jump, which hurts CLS.
- Elements with no reserved space. An image, an ad or a cookie banner that pops in without a reserved slot makes the layout jump. That is exactly what penalises the French Wikipedia page in our example.
How to improve website speed: where to start
Here is the order we follow. It does not always match the order of the PageSpeed report, because we rank actions by their real effort-to-gain ratio, not by their theoretical weight.
Step 1: fix the images
This is often the fastest and cheapest win. Resize each image to the size at which it is actually displayed (an image shown 800 pixels wide does not need to be 4,000 pixels wide), then convert it to WebP, a format all current browsers support and that produces noticeably lighter files than JPEG at comparable quality (Google Developers). The free tool Squoosh does this in the browser, with nothing to install. On WordPress, an image optimisation plugin can convert uploaded files automatically.
Then add lazy loading for images further down the page: they only download when the visitor scrolls to them (MDN). Be careful, however, never to apply it to the main image at the top of the page: that delays the LCP itself.
Step 2: check hosting and caching
If TTFB is poor, no amount of image optimisation will make up for it. Check that page caching is active (the server sends a ready-made version instead of rebuilding the page on every visit), that compression is enabled, and that your PHP version is not ancient if you run WordPress. A content delivery network (CDN) can also bring your files closer to your visitors. Sometimes the honest conclusion is that you need a different host. It is not what people want to hear, but it is often the most cost-effective answer.
The server matters as much as the images. LiteSpeed and caching help, but distance matters too: an Asian or European datacenter can hurt visitors in Cotonou or Abidjan. Test before/after any move (PageSpeed). Shinjiru advertises LiteSpeed on shared plans; compare it with a local or regional FCFA-billed host. Shinjiru (affiliate link: if you sign up through this link, we may earn a commission at no extra cost to you).
Step 3: clean up plugins and scripts
List everything that loads on your home page and ask a blunt question about each item: would anyone miss it if it disappeared tomorrow? The home page slider nobody looks at, the Instagram widget, the second analytics tool installed "just in case": remove them. For chat, a simple WhatsApp button with a direct link weighs almost nothing compared to a full chat widget.
Step 4: stabilise the layout
To lower CLS, give every image and video explicit dimensions (width and height), reserve space for banners and ads before they arrive, and avoid inserting content above what the visitor is already reading. Also limit the number of fonts and prefer system fonts when your visual identity allows it.
Step 5: measure again, then keep watching
Run PageSpeed Insights again after each round of changes. Keep a dated record of the results (a simple screenshot is enough) so you can compare. Field data can take up to 28 days to fully reflect your improvements, since the report covers that rolling period, so do not lose heart if the top part of the report moves slowly. After that, check speed whenever you add something significant to the site. Slowness rarely comes back all at once; it creeps in one plugin at a time. That is one reason regular monitoring belongs in website maintenance.
Our rule: we do not optimise for a score, we optimise for the visitor opening your page on an average phone with an average connection. The score follows.
Mistakes that waste your time
- Chasing 100/100. Google itself writes that trying to get a perfect score just for SEO reasons may not be the best use of your time (Google Search Central). Going from 90 to 100 often costs more than it brings. Going from 35 to 75, on the other hand, genuinely changes the experience.
- Testing only on desktop. The mobile score is almost always lower, and it is the one that reflects most of your audience.
- Judging speed on your own phone. Your browser has already cached the site, and your connection is not necessarily your customers' connection. The tools exist precisely to get you out of that bias.
- Stacking "optimisation" plugins. Three caching plugins stepping on each other slow the site down instead of speeding it up, or even break it.
- Confusing speed with mobile-friendliness. A site can be perfectly readable on a phone and still slow, or the other way round. The two are checked separately: for display, see our guide What is a responsive website and how to check it.
When should you call a professional?
Many improvements are within your reach: compressing images, removing useless plugins, dropping a slider. Do them, they are free. However, some signs indicate that a technical diagnosis will pay off better than random attempts:
- TTFB stays high despite a caching plugin;
- the mobile score is stuck below 50 after the images have been fixed;
- INP is poor, which usually points to heavy JavaScript that is hard to untangle without development skills;
- the site is an online store, where every lost second shows up in orders (see also How to create an online store in Benin);
- the site is so old and so overloaded that the real question becomes: optimise or rebuild?
On that last point, we are frank with our clients: sometimes a rebuild costs less than a series of patches. But it is not automatic, and we only suggest it after measuring. If your site is not generating enquiries, speed is only one of the possible reasons: our article Why your website is not bringing customers covers the others.
As for budget, there is no single price for "speeding up a website": it depends on the technology, the hosting and the state of the code. At Guelichweb, we provide a quote after a diagnosis, as with all our offers.
Frequently asked questions about website speed
What is a good loading time for a website?
The most useful benchmark is LCP: 2.5 seconds or less for at least 75% of visits, on both mobile and desktop. That is the threshold Google uses to rate loading as "good". The time to load the "entire" page matters less than the moment the main content becomes visible.
Is Google's speed test free?
Yes. PageSpeed Insights, Lighthouse and Search Console are completely free. PageSpeed Insights does not even require an account.
Why does my PageSpeed score change every time I test?
Because the score comes from a single lab test that is sensitive to conditions at that moment: server load, network, changing ad content. Differences of a few points are normal. Run several tests and rely more on real-world data when it is available.
Why is the real-user data section empty for my site?
Because your site, or the page you tested, does not yet get enough visits from Chrome for Google to publish reliable statistics. You can try the "Origin" tab, which groups the whole site together. Otherwise, rely on the lab test.
Does Google penalise slow websites?
Core Web Vitals are part of what Google's ranking systems take into account, but content relevance comes first. A slow site is not "punished"; it simply starts with a handicap against an equally relevant, faster competitor. And it loses visitors before Google even comes into play.
Is WordPress always slow?
No. A well-hosted WordPress site with a lightweight theme, few plugins and optimised images can perform very well. Slowness almost always comes from what has been added on top, not from WordPress itself.
Want to know why your website is slow?
Start with a PageSpeed Insights test, mobile first. If the result worries you or you do not know where to begin, we can look at it with you: we analyse the pages that matter, identify the two or three main causes, and tell you what you can fix yourself and what needs technical work.
Ask us for a speed diagnosis of your website: a faster site means more visitors who stay, and less data wasted for your customers.