What is Google Analytics 4? How to track visits to your business website
G. CHRIST
Published on October 25, 2026

"How many people actually visit our website?" It is often the first question the director of a small business, an NGO manager or the communications officer of a public institution asks us when we talk about their site. And the most common answer is an awkward silence: nobody knows. The site exists, it cost money and time, but it runs blind.
Google Analytics 4, usually shortened to GA4, exists to clear that fog. It is Google's free tool for measuring website visits: how many people come, where they come from, what they read and what they do before leaving. In this guide we explain what it is, how to set it up properly in half an hour, and above all which numbers matter when you run an organisation in French-speaking Africa or anywhere else, without becoming a data analyst.
One warning up front: GA4 is only useful if you decide in advance what a "successful" visit looks like. Without that, you get pretty charts and no decisions. So we will talk about method as much as about the tool.
Official Google Analytics logo (Wikimedia Commons file, trademark of Google LLC).
What is Google Analytics, exactly?
Google Analytics is an audience measurement service. You add a small tracking code (the "Google tag") to every page of your site; on each visit, that code sends Google information about the browsing session: the page viewed, the device, the country, the source of the visit and important clicks. You then read all of it in an online interface, organised into reports.
The current version is called Google Analytics 4. The previous one, Universal Analytics, stopped processing new data on 1 July 2023 for standard accounts, and Google then removed access to all Universal Analytics properties and their data from July 2024 (Google's help page on the end of Universal Analytics). If someone installed "Google Analytics" on your site before 2023 and nobody has touched it since, there is a good chance you are measuring nothing at all.
Small businesses and NGOs often ask whether it is free or paid. Google presents Analytics as a set of no-cost tools; there is a paid version, Analytics 360, designed for very large organisations with unusual data volumes and support needs. For a business website, a reasonably sized online store or an institution's site, the free version is more than enough.
Source: official Google Analytics page, marketingplatform.google.com, captured on 25/10/2026.
What changed with GA4
GA4 no longer thinks in "page views" but in events. A page displayed is an event, a click on an outbound link is another, a submitted form is another. That model is a big advantage for a small organisation: you can track exactly the actions that matter to you, such as a click on the WhatsApp button or the download of an annual report in PDF.
The famous "bounce rate" was also redefined. GA4 talks about engaged sessions: a visit that lasts longer than 10 seconds, or triggers a key event, or shows at least two pages. Engagement rate is the share of engaged sessions, and bounce rate is simply its inverse (official definition). It is fairer than before: a visitor who reads your contact page for two minutes and then calls you is no longer counted as a failure.
Google Analytics or Search Console: which one does what?
This is the confusion we run into most often. Both tools are free, both come from Google, but they look at different moments.
- Google Search Console looks before the click: which Google searches show your site, how often, at what position, and how many people click. We cover it in our guide on how to appear on Google.
- Google Analytics looks after the click: what visitors do once on the site, wherever they came from (Google, Facebook, WhatsApp, a link in an email, a poster with a QR code).
- Google Business Profile insights look at your local presence: calls, direction requests and website clicks from Google Maps. See our guide to creating your Google Business Profile.
Our position is simple: a serious business website needs the first two, and any organisation that receives the public needs all three. You can also link Search Console to Google Analytics to see Google queries directly inside GA4.
Setting up Google Analytics 4 in 30 minutes, step by step
Setup is not complicated, but a few settings made on day one save you months of wrong numbers. Here is the order we follow, in line with Google's official setup procedure.
- Create the account with an organisation address, not with the intern's or the contractor's personal Gmail. The day that person leaves, you lose access to your history. Then add other people as users.
- Go to analytics.google.com and click "Start measuring". Name the account after your organisation.
- Create a property (the space that represents your website). Choose the country and time zone you work in, and the currency: the West African CFA franc (XOF) in Benin, Côte d'Ivoire or Senegal, XAF in Cameroon, or your own currency elsewhere. A wrong time zone shifts all your daily statistics.
- Enter your industry category and business size, then your objectives. These choices are not final; they mostly shape the default reports.
- Add a Web data stream with your site's address. Google gives you a "Measurement ID" starting with G-. Leave enhanced measurement switched on.
- Install the tag on every page. Three options: paste the code into the site header, use Google Tag Manager (the option Google recommends when you manage several tags), or use your CMS's official plugin. On WordPress, Google's Site Kit plugin does the job in a few clicks; see also our article what is WordPress and when to choose it.
- Check the Realtime report by opening your site on your phone. If your visit appears within a minute, the tag works.
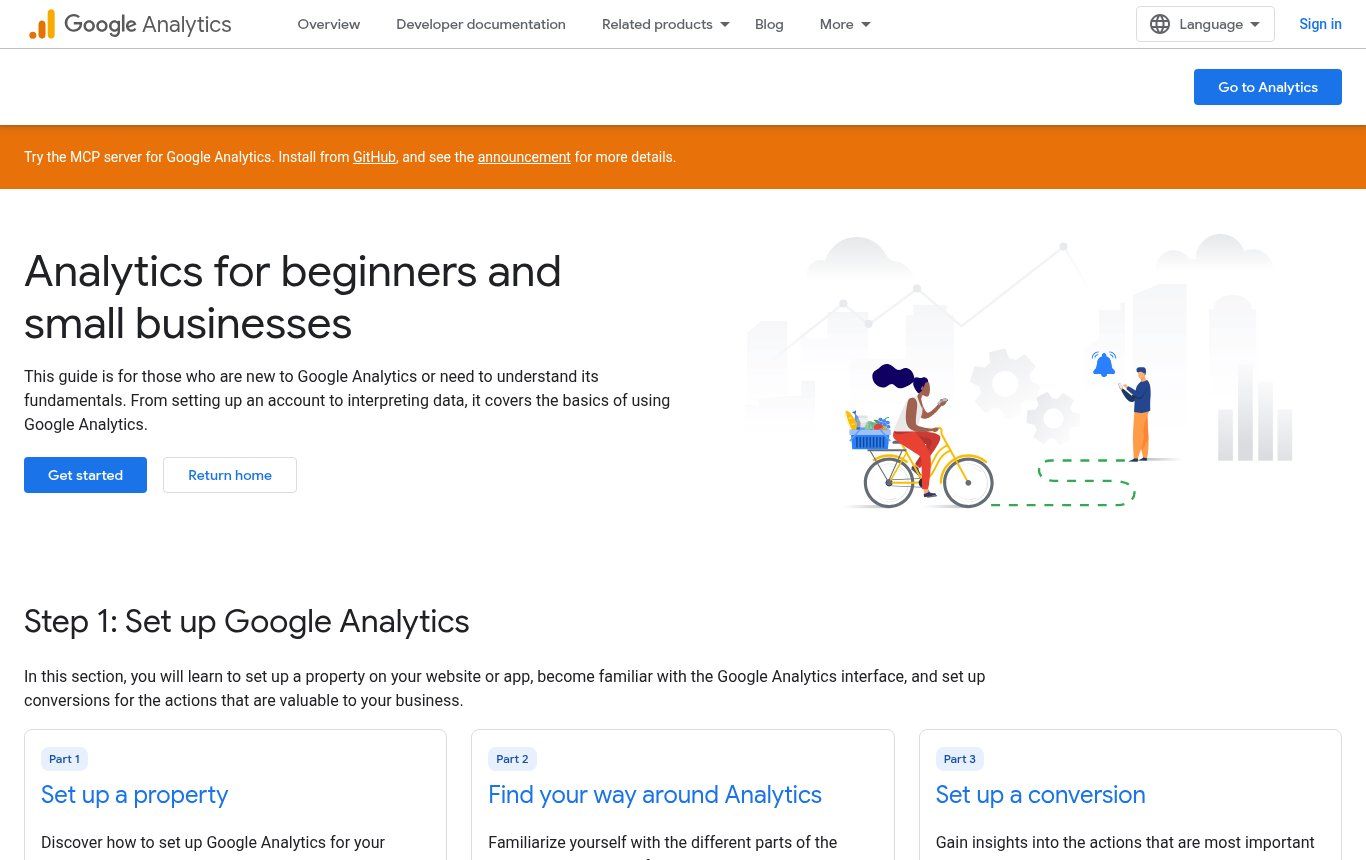
Source: Google guide "Analytics for beginners and small businesses", developers.google.com, captured on 25/10/2026.
If an agency or freelancer built your site, ask them explicitly whether a GA4 tag is in place, with which Measurement ID and on which Google account. We ask that question every time we audit a site for website maintenance.
Three settings to change on day one
- Set data retention to 14 months. By default, GA4 keeps detailed user- and event-level data for only 2 months on a standard property. That does not affect standard reports, but it limits your explorations: no fine-grained comparison with last year (data retention).
- Exclude your own visits. In a small organisation, the team can be a huge share of traffic. Google lets you define internal traffic and filter it out based on your IP addresses. Test the filter before activating it, because an active filter permanently excludes matching data.
- Link Search Console to combine Google queries with on-site behaviour.
The reports to read (and the ones you can ignore)
GA4 contains dozens of reports. A manager needs four or five. The rest is for marketing teams running ads all year round.
1. Users and sessions
Users approximates the number of distinct people; sessions, the number of visits. Look at the trend over three months, never at a single week: a radio campaign, a public holiday or a network outage is enough to create a spike or a dip.
2. Acquisition: where visitors come from
The Acquisition report separates Google search ("Organic Search"), social networks, direct traffic and referring sites. In West Africa, a large share of traffic comes from links shared on WhatsApp or Facebook. The catch: a link opened from the WhatsApp app often arrives with no source information and lands in "Direct". The fix is to add UTM parameters to the links you share (for example ?utm_source=whatsapp&utm_medium=status&utm_campaign=backtoschool) so GA4 can file them in the right place.
3. Engagement: pages and screens
This report shows your most viewed pages and their average engagement time. It is where you spot a services page read by many people that leads to no enquiries, or a blog post attracting traffic unrelated to your business.
4. Key events
This is the most important report, and the one almost nobody sets up. A key event (what GA4 used to call a "conversion") is an action you consider valuable. A standard property can mark up to 30 of them, and a new key event can take up to 24 hours to appear in reports (help page on key events).
5. Devices and countries
Check the mobile share. If the vast majority of your visitors are on phones but your enquiries come mostly from computers, your mobile version probably has a problem. Our article on responsive websites shows how to check it in five minutes.
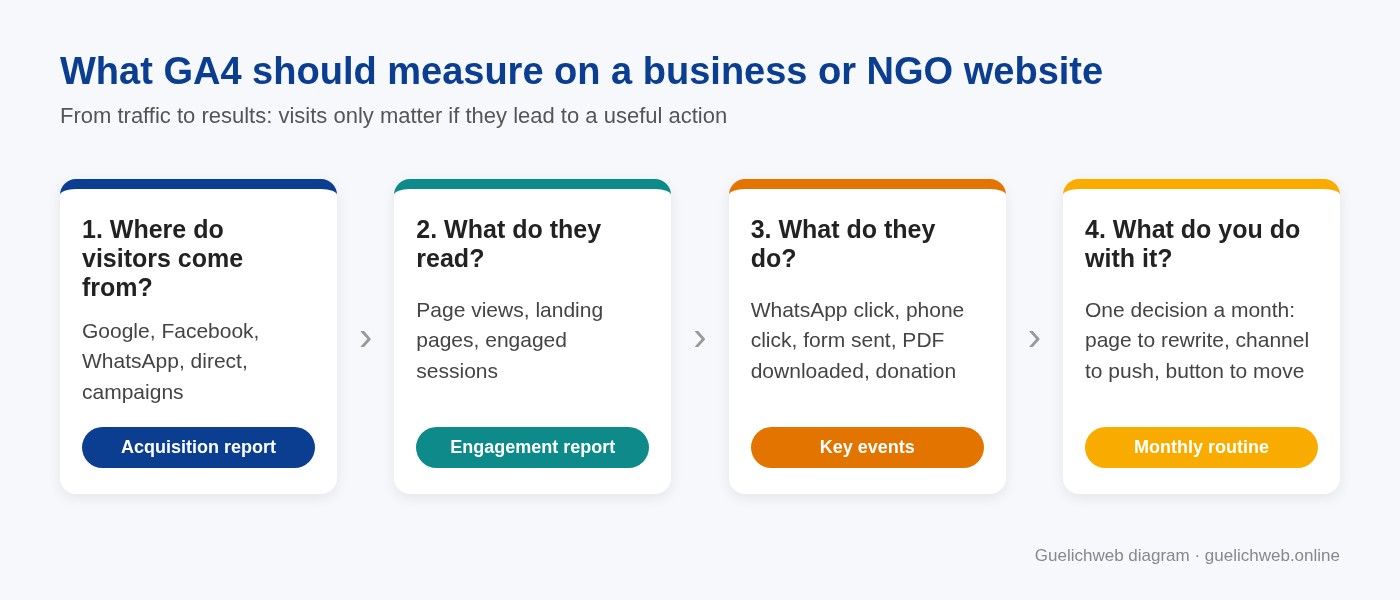
Guelichweb diagram: the four questions GA4 should answer on a business or NGO website.
Which key events should a small business, NGO or institution track?
GA4's enhanced measurement already tracks several actions automatically: scrolling, outbound clicks, site search, embedded YouTube videos, file downloads such as PDFs, and some form interactions (official list). Your job is to choose the ones that matter and mark them as key events. Here is our selection by type of organisation.
- Service businesses: contact or quote form submitted, WhatsApp button click (wa.me link), phone number click, visit to the pricing or offers page.
- Online stores: add to cart, begin checkout, purchase (the purchase event is a key event by default). See also our guide to creating an online store in Benin.
- NGOs and associations: click on "Donate", annual report download, newsletter sign-up, application to a call for proposals.
- Institutions and local authorities: administrative form downloads, visits to procedure pages, site search (what citizens look for and cannot find is a goldmine).
Our advice: no more than five key events to start with. Beyond that, nobody reads them. And be careful with automatic form tracking: depending on how your form is built, submissions are not always detected correctly. Run a real test and check that it shows up before trusting the number. Clicks on tel: links are not necessarily captured without setup either; Google Tag Manager handles those cases cleanly.
A website with 3,000 visits and zero measured enquiries is not a website that performs badly. It is a website nobody knows is performing at all.
Consent and personal data: what you need to know
Google Analytics sets cookies and collects browsing data. In Benin, the Digital Code (law no. 2017-20) governs personal data protection, overseen by the personal data protection authority (APDP). If your site receives European visitors, the GDPR also applies to their data, and other countries have their own rules. We explained how cookies and trackers work in a dedicated article.
In practice we recommend three things: a consent banner that offers a real choice, a privacy policy that mentions Google Analytics, and Google's consent mode, which adjusts how tags behave depending on the visitor's choice. This is not legal advice: for an institution or NGO handling sensitive data, have your setup reviewed by a lawyer or the relevant authority.
One practical consequence to accept: with genuine consent, some visitors decline and your numbers are lower than reality. That is normal. What matters is trends and proportions, not the absolute figure.
The mistakes we see most often
- No key events configured. You measure visits, never results.
- The account belongs to the contractor. The day you change agency, the history disappears. Insist on being an administrator of your own property.
- Two tags on the same site. One added by a plugin, one pasted by hand: every visit is counted twice and the engagement rate becomes absurd.
- Wrong time zone or currency, set in a hurry when the property was created.
- Retention left at 2 months, which limits comparative analysis.
- The team counts as the audience. Without an internal traffic filter, your own visits inflate the numbers.
- Looking at numbers without a question. Opening GA4 "just to see" almost always ends with no decision.
If your site attracts visitors but generates no enquiries, the measurement tool is rarely the problem. We listed the usual causes in why your website is not bringing customers.
A 20-minute monthly routine to make decisions
Here is the routine we recommend to managers who have no time. Once a month, same day, same hour:
- Compare users and key events for the past month against the previous three months.
- Look at the top three acquisition sources: which one brings enquiries, not just visits?
- Find the most viewed page that leads to no action. That is your project for the month.
- Check Search Console for queries that show your site without getting clicks: rewriting a title may be enough.
- Write down one decision and apply it before next month.
One decision a month sounds small. Over a year, it adds up to twelve fact-based improvements, which is far more than most business websites ever get.
Automate the report instead of opening GA4
Let us be honest: most managers will never open GA4 on their own. The answer is not to train them on the interface, it is to bring the numbers to them. Two free or low-cost approaches work well.
- A [Looker Studio](https://lookerstudio.google.com/) dashboard (Google's free dashboard tool) connected to GA4, with four or five indicators on a single page that can be shared by link.
- An automated report: an automation tool such as n8n has a Google Analytics node that can fetch reports. You can send a summary by email every Monday, save it to Google Sheets or push it to a team channel. If you are unsure which tool to use, our comparison n8n or Make will help.
That is exactly the kind of small system we build at Guelichweb: the website measures, the automation summarises, the manager decides.
Do you have to use Google Analytics?
No. GA4 is powerful, free and well documented, but its interface puzzles many beginners, and personal data concerns push some organisations towards other tools. The best-known alternatives:
- [Matomo](https://matomo.org/): open source, can be installed on your own server, popular with institutions that want to keep control of their data.
- [Plausible](https://plausible.io/): very simple, a single statistics page, designed to limit personal data collection. Paid service (or self-hostable).
- [Umami](https://umami.is/): open source and lightweight, in the same spirit as Plausible.
Our view: for a business that runs or will run Google Ads, or wants to combine its data with Search Console, GA4 remains the most practical choice. For a public institution committed to hosting its own data, or a small organisation that simply wants to know how many people come by, a lighter tool is often the more sensible option. The worst choice is to measure nothing.
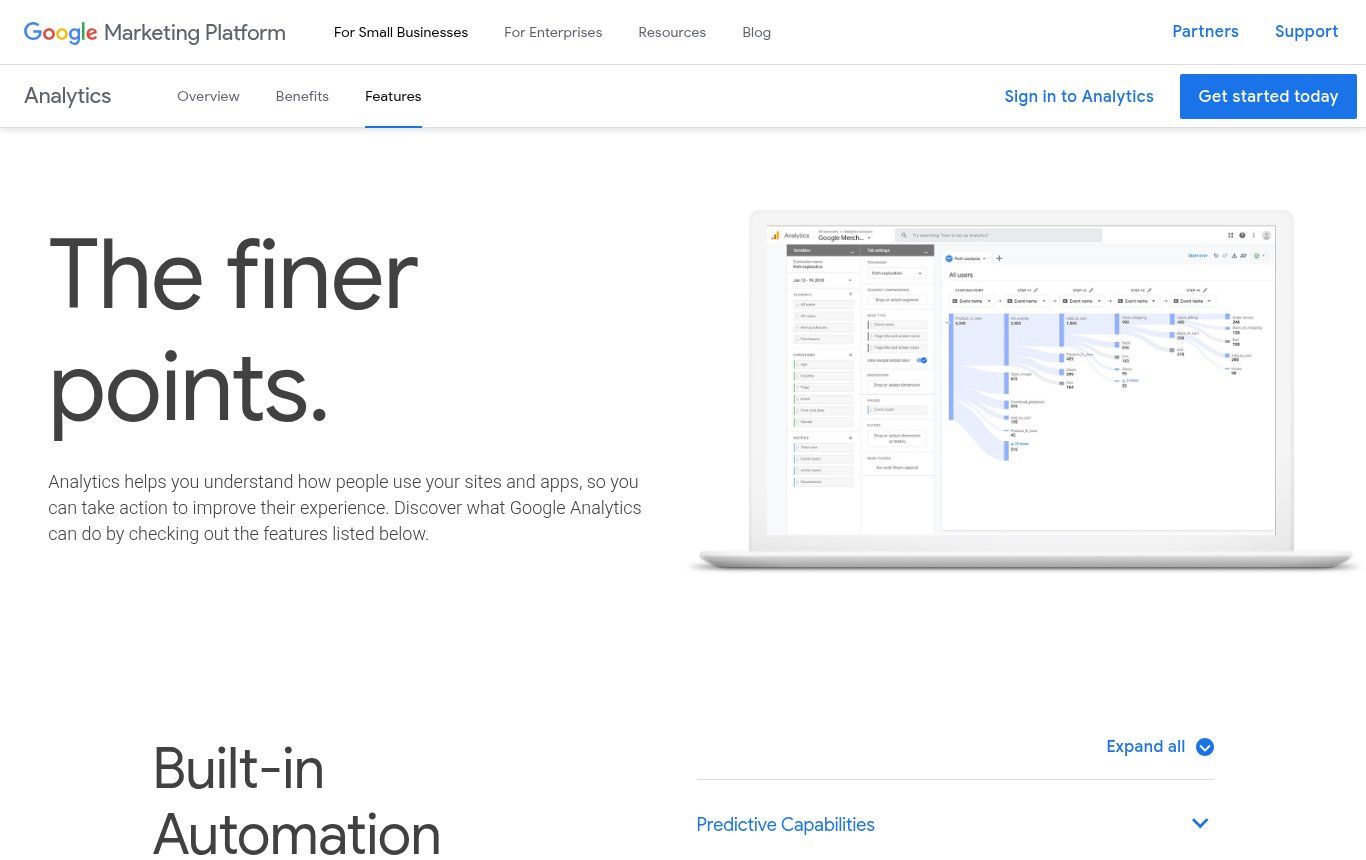
Source: Google Analytics features page, marketingplatform.google.com, captured on 25/10/2026.
What Google Analytics will never tell you
GA4 counts behaviour, not intentions. It will not tell you why a visitor left, whether the person who clicked on WhatsApp eventually bought, or whether your customers heard about you by word of mouth before typing your name into Google. To fill those gaps, nothing beats one simple question asked of every new customer: "How did you hear about us?" Record the answer in your CRM or a simple spreadsheet, and compare it with GA4 once a quarter.
Keep in mind too that ad blockers, declined cookies and some browsers reduce measurement. GA4 numbers are a reliable estimate of trends, not an exact counter.
FAQ: Google Analytics 4
Is Google Analytics really free?
Yes, the standard version is free and covers the vast majority of business, NGO and institutional websites. The paid version, Analytics 360, targets very large organisations.
What is GA4 compared with Google Analytics?
They are the same thing: GA4 is the current version of Google Analytics. The old version, Universal Analytics, has not collected data since July 2023 and its data was deleted in 2024.
How long before I see data?
The Realtime report shows visits within seconds. Standard reports usually fill in within 24 to 48 hours, and a new key event can take up to 24 hours to appear.
Can I try GA4 without installing it?
Yes. Google offers a demo account with real data from its merchandise store. It is ideal for getting familiar with the reports before setting up your own site.
Do I need a developer to install Google Analytics?
Not for a basic installation, especially on WordPress or a CMS with an official plugin. Setting up custom key events (WhatsApp click, form, call) and consent reliably does require some technical work.
Does Google Analytics improve my SEO?
No, not directly. Installing GA4 does not move a site up in Google. It does help you spot the pages that attract and the ones that disappoint, so you can work better on your SEO keywords and content.
In short
Google Analytics 4 is the free tool that tells you who visits your website and what they do there. Properly installed, with five chosen key events, a filter on your own visits, 14-month retention and a monthly routine, it turns a "brochure" website into a management tool. Poorly installed, it produces charts nobody reads.
At Guelichweb, we install and configure audience measurement on every website we build or redesign, and we can audit an existing GA4 setup or build an automated report for your management team. Pricing depends on your site and your goals: we send a quote after an initial assessment. Explore our services and offers, or contact us so we can look together at what your website really measures.